option chain in trading An option chain lists all option contracts, including put and call option for given security. However, several traders focus on net change,' 'bid,' 'last price,' and 'ask,' columns to assess current market conditions. Option chain is also called the option matrix.
It proves useful for assessing the depth and liquidity of specific strikes. It aids traders to find option premium against its corresponding maturity date and strike price. Option chain serves as a warning against breakouts or sharp moves in the index.
Search in ideas for "option chain"

Option chainAn option chain is a comprehensive list that shows you all available option contracts for a given stock. These are sorted by their expiration date, which is the last day you can trade or use the option, and strike price, which is th
e price at which you can buy (call) or sell (put) the stock.
Options chain can be defined as the listing of all option contracts. It comes with two different sections: call and put. A call option means a contract that gives you the right but does not give you the obligation to buy an underlying asset at a particular price and within the option's expiration date.

OPTION CHAIN TRADINGAn option chain is a comprehensive list that shows you all available option contracts for a given stock. These are sorted by their expiration date, which is the last day you can trade or use the option, and strike price, which is the price at which you can buy (call) or sell (put) the stock.
A call option buyer stands to profit if the underlying asset, say a stock, rises above the strike price before expiry. A put option buyer makes a profit if the price falls below the strike price before the expiration.

Option chain part 1Nifty option chain is considered to be the best advance warning system of sharp moves or break outs in the index.
More specifically, high open interest in call options signifies a bullish sentiment, while high open interest in put options suggests a bearish sentiment. Open interest is tracked separately for call and put options.
LTP (Last Traded Price) – is the last traded price or premium price of an option. CHNG – is the net change in LTP.

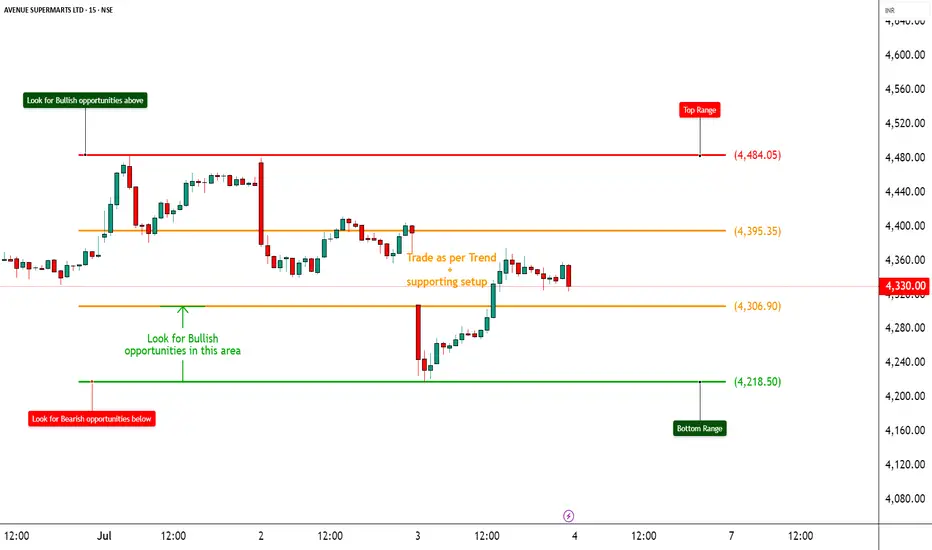
DMART – Mixed Signals with Option Chain Clues________________________________________________________________________________📈 DMART – Mixed Signals with Option Chain Clues | Option Chain + Price Action Analysis
🕒 Chart Type: 15-Minute
📆 Date: July 3, 2025
________________________________________________________________________________
🔍 What’s Catching Our Eye:
DMART is displaying notable volatility near its technical range. While the option chain reveals contrasting setups across strikes—with several Calls showing short build-ups and some Puts indicating long build-ups—the overall price action remains undecided. The current equity price (spot at 4348.70) is being carefully watched in relation to its normalized chart range.
________________________________________________________________________________
📌 What We’re Watching For:
We’re monitoring for a decisive move beyond the established range. A sustained move above the Top Range of 2464.4 (normalized chart level) could validate a bullish reversal; conversely, a breakdown below the Bottom Range of 2326.1 might trigger a bearish slide. Given the option chain dynamics, any clear directional breakout—supported by volume—will be key to shaping our view.
________________________________________________________________________________
📊 Volume Footprint:
Today’s volume is recorded at 1.83M, significantly higher than the previous 836.47k, indicating an active session. A continued high volume reading on a breakout or breakdown from our range will be critical for confirmation.
________________________________________________________________________________
📈 Option Chain Highlights:
• On the Call side, the 4,500 CE and 4,300 CE are showing strong short build-ups, while the 4,400 CE stands out with a long build-up—hinting at an emerging bullish bias if the price rallies. Additionally, the 4,600 CE continues to exhibit short build-up pressure.
• On the Put side, the 4,200 PE displays a strong long build-up, suggesting downside protection, and the 4,000 PE also shows long build-up. A notable short covering is observed in the 4,300 PE and the 4,250 PE shows additional long build-up.
These option-chain cues—combined with the volatility in the underlying—highlight the market’s mixed expectations.
________________________________________________________________________________
🔁 Trend Bias:
The bias remains directionally dependent—bullish if a reversal above the top range is confirmed, or bearish if the price falls below the bottom range.
________________________________________________________________________________
🧠 Trade Logic / Reasoning:
DMART’s price action is teetering near its critical range. The normalized technical levels (Top Range: 2464.4, Bottom Range: 2326.1) serve as key decision zones. On the options side, the presence of long build-up in the 4,400 CE suggests that, if the price reverses, buyers could step in. In contrast, the strong long build-up on the 4,200 PE underlines the protective positions if the price breaks lower. With a higher session volume amplifying the move’s significance, caution is warranted until a clear breakout or breakdown occurs.
________________________________________________________________________________
📍 Important Levels to Mark:
🔺 Top Range: 2464.4 – Look for a breakout or a reversal candlestick pattern with confirmatory volume
🔻 Bottom Range: 2326.1 – Watch for a breakdown or a bullish reversal pattern with volume support
________________________________________________________________________________
🎯 Trade Plan (Educational Purpose Only):
✅ Best Buy (Equity): Enter long on DMART if a robust bullish reversal is confirmed—ideally when the price reclaims above the top range (2464.4) with strong volume and supportive candlestick action.
✅ Best Sell (Equity): Take short positions if the price decisively breaks and holds below the bottom range (2326.1) on high volume.
✅ Best CE to Long: Opt for the 4,400 CE when the reversal is underway; its long build-up in the option chain signals the initiation of bullish interest.
✅ Best PE to Long: In a bearish scenario, consider the 4,200 PE—its long build-up indicates traders are positioning for a downside move.
🟢 Demand Zone: NA
🔴 Supply Zone: NA
⚠️ Invalidation Below:
Any bullish setup becomes invalid if DMART breaks and holds below the bottom range of 2326.1 (normalized level) with strong volume.
________________________________________________________________________________
⚠️ Disclaimer:
This post is for educational purposes only.
STWP is not a SEBI-registered advisor.
This is not a buy/sell recommendation.
Please consult your financial advisor before trading.
STWP is not responsible for any trading outcomes.
________________________________________________________________________________
💬 Found this helpful?
Drop your thoughts in the comments ⬇️
🔁 Share with fellow traders
✅ Follow STWP for zone-based price action & option chain insights
🚀 Let’s boost awareness of smart & patient trading!
________________________________________________________________________________
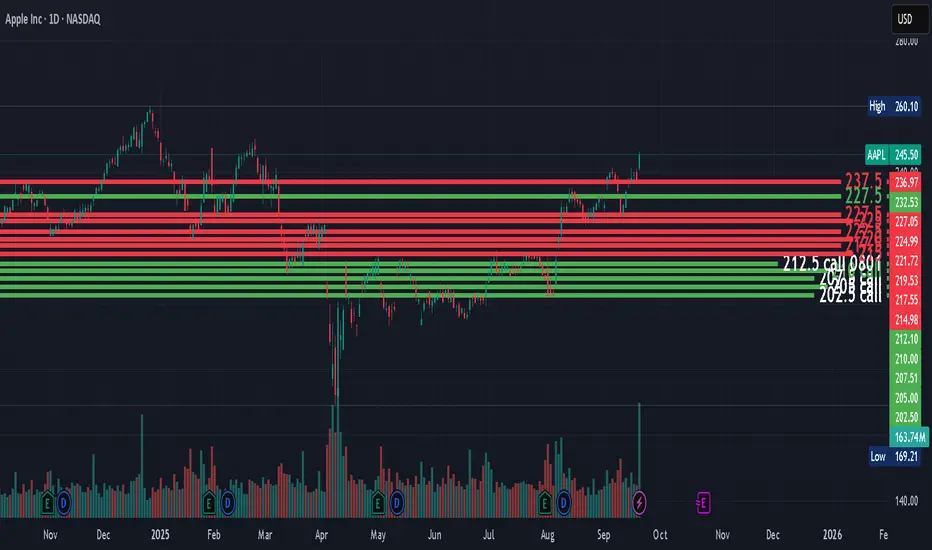
Bullish Signs from AMZN Options Chain Sept 29, 2025Bullish Signs from AMZN Options Chain
The AMZN options chain for the September 26, 2025 expiry shows strong buy-side activity, with significant open interest in near-term call options around key strike prices such as 230, 235, and 240. Notably, the open interest stands at 30,319, 27,281, and 25,454 contracts respectively, accompanied by increasing trading volumes, indicating solid market confidence.
Moreover, the call option Delta distribution and the implied volatility levels suggest that institutional players are leaning bullishly, and volatility remains moderate, implying there is room for continued upward momentum without panic buying.
Overall, the positioning and trading volume in the options market reflect active accumulation by both institutional and retail investors, signaling strong short-term bullish momentum for AMZN, and increasing the likelihood of the stock challenging new highs in the coming week.
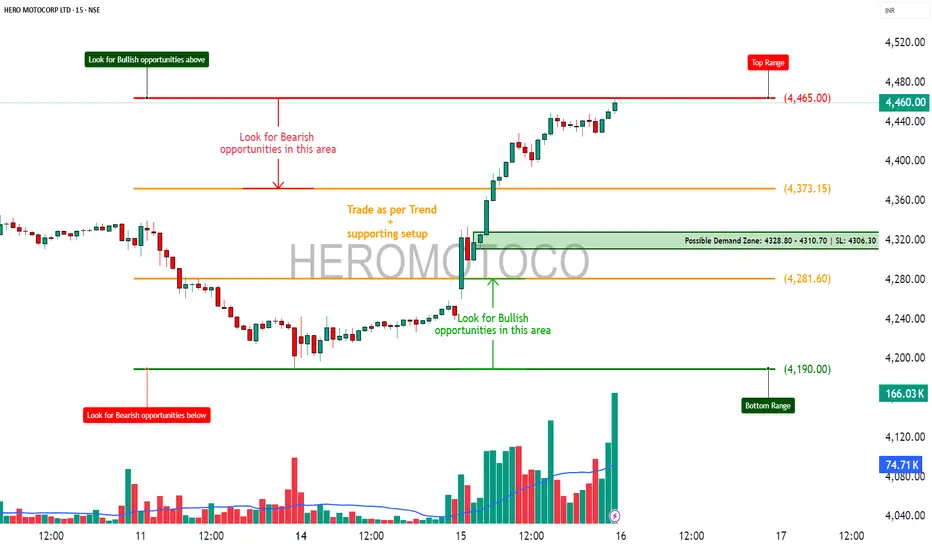
HEROMOTOCO – Option Chain + Price Action Intraday Setup________________________________________
📊 HEROMOTOCO – Option Chain + Price Action Intraday Setup
🕒 Chart Type: 15-Min Timeframe
📅 Date: July 15, 2025
🎯 For Educational Purpose Only
________________________________________
🔍 Chart Observations:
• Clean rally supported by increasing volume.
• Price nearing the Top Range / Resistance at ₹4465.
• A visible Demand Zone formed between ₹4328.80–₹4310.70 with a strong bounce.
• Volume spike confirms strong buying interest near demand levels.
________________________________________
🔢 Option Chain Insights:
🔼 Call Side Activity:
• 4500 CE: Massive Long Build Up — OI +111.76%, premium ₹52.3 → Suggests strength.
• 4450 CE: Also saw strong Long Build Up with rising premium.
• 4400 CE: Witnessed aggressive Short Covering, adding fuel to bullish momentum.
📈 Interpretation: Option writers are unwinding shorts on 4400, and 4500 is seeing heavy buildup — bullish sentiment.
🔽 Put Side Activity:
• 4400 PE: Sharp Short Build Up, IV at 34.5 → Puts being sold aggressively = Bullish bias.
• 4300 PE: Also saw strong Short Build Up, with OI rising despite falling premiums.
📉 Interpretation: Put writers are confident on downside support holding.
________________________________________
✅ Trade Plan Breakdown:
🔼 1. Best Buy – "Buy on Dip to Demand"
• Entry: ₹4328 – ₹4310 (Demand Zone)
• SL: ₹4306
• Risk Reward: 1:1 | 1:2 +
• Logic: Re-entry near demand zone + strong put writing + bullish volume = trend continuation
________________________________________
🔽 2. Best Sell – "Fade the Supply"
• Entry: ₹4460 – ₹4465 (Supply Zone)
• SL: ₹4475
• Risk Reward: 1:1 | 1:2 +
• Logic: Price near resistance with possible exhaustion. CE premiums elevated → good short-risk area
________________________________________
🟢 3. Best CE – "Momentum Play Above ₹4465"
• Strike: 4500 CE
• Trigger: If price breaks above ₹4465 with volume
• Logic: LTP ₹52.3 with Long Build Up, high delta (0.47) → Ready for breakout rally
________________________________________
🔴 4. Best PE – "Rejection Trade Below ₹4430"
• Strike: 4400 PE
• Trigger: If spot breaks below ₹4430
• Logic: LTP ₹95.75, Short Build Up suggests hedge-unwinding or trap possibility on failure
________________________________________
📦 5. Applicable Demand and Supply Zones
• Demand Zone: ₹4328.80 – ₹4310.70 (SL: ₹4306.30)
• Supply Zone: ₹4460 – ₹4465
• Mid-level Zones:
o Watch for support at ₹4373.15
o Breakdown area at ₹4281.60
• Bottom Range Support: ₹4190.00
________________________________________
💬 STWP Summary View:
The sentiment is strongly bullish, backed by long buildup in calls and short buildup in puts. If price breaks above ₹4465, momentum CE trades can fly. But supply pressure could give quick fade setups for scalpers too.
________________________________________
⚠️ Disclaimer (Read Before Trading):
• This setup is shared for educational purposes only.
• No investment advice or trade recommendation is being made.
• Always use proper risk management.
• STWP is not a SEBI-registered advisor.
• Markets involve risk. Trade with a plan, not with emotions.
________________________________________
💬 Found this helpful?
Drop your thoughts or questions below ⬇️
🔁 Share with your trading circle to help them navigate zone-based trades.
✅ Follow @simpletradewithpatience for smart charts, clean setups & demand-supply backed analysis.
📊 Let the price guide you — trade with patience, charts, and clarity!
________________________________________
NSE Stops updating OPTION CHAIN !!Does NSE wish to keep most of us in the Blind by not updating the Option chain on it's website? It stopped updating on Friday itself.
Is there any other credible source? I can see option chain on Sensibull, but you need to manually count oi to get PCR and other stuff.

Add the option chain Please provide the option chain chart . buy and sell in this apk . please provide the Indian market buy and sell. Please add benk account linked in this app aad the money option miss this app.✔️

21 April 2022 BankNifty Trading Setup with Option Chain 21 April 2022 BankNifty Trading Setup with Option Chain
BankNifty Chart Analysis for Option Trading on 21 April
For More Updates Search In Google -Trading With Manoj Shinde 27485
Open Interest Chart Analysis
Resistance For BankNifty Tommrow
As per Open Interest Data 36500 is Resistance for BankNifty , If Change in Open Interest also Positve then Nifty Will not go above 36500 If Sustain above 36500 Next Resistance is 36800.
Support For BankNifty Tommrow
As per Open Interest Data 36000 is Support forBankNifty , If Change in Open Interest also Positve then Nifty Will take Support on 36000 After 17000 Next Support is 35800 .

Nifty Expiry Set up & Option chain Nifty Expiry Set up & Option chain
Nifty Cleared resistance -17800
Next one -18000
Support -17800 -1770
Nifty Bank -
Trend
Bullish - Resistance 41710 -42000
support 41600

Banknifty option chain analysis for monthly expiryIn this video I have done banknifty option chain analysis for monthly expiry.
Watch the video till last for better understanding.

cipla analysis on basis of option chain if cipla comes in the demand zone its very good opportunity to go long. this is very good demand zone on basis of option chain & put call ratio is very high.
if you want zones of your stock please comment.

BANKNIFTY WITH THE HELP OF OPTION CHAIN CHART BANKNIFTY
Chart with the help off option chain
RESISTENCE = 36200/400/37000
SUPPORT = 35500/700/800

NIFTY SHORT CALL Using Option Chain!!!!Today nifty made a hammer on the upper side of the trend but hammer is not good on the upper side of trend so i think its time for some reversal.
You can see when in a upper trend a hammer shows on the top its mostly a following red candle so ready for some reversal.
And yesterday where option chain was so bullish with very heavy PUT writing but today we see so much of PUT unwinding so lets see whats happens my targets on the chart
GOOD LUCK.....


BANKNIFTY view for 22nd January 2020Option Chain Analysis indicates a sideways trend.
I am a little bullish.
There seems to be a sentiment of fear in the market and therefore this dip also might be bought out by the market.
Long above 32400:
Target 1: 32600
Target 2: 32700
Target 3: 32850
Short below 32050:
Target 1: 31850
Target 2: 31700
Target 3: 31200
I prefer not to use stop loss in banknifty because banknifty always seems to hunt for stop losses. Use levels along with the price action analysis to decide the stop loss. Eg: The MACD is showing convergence and a bullish crossover is evident in the 15 minutes chart but a red candle with a big tail is forming in the 5 minutes time frame which might take out your stop loss but when viewed in a larger pictures was just a bear trap, and you being the bull were trapped in the bear trap, which might happen all the time. A great idea could be to start looking at the last few ticks of a candle for a signal of whether stop loss hunting is taking place or genuinely stop loss has been hit.
Note: Post only for education purposes.

Long BritanniaOption chain analysis and cup and handle suggesting long.
3600CE seller exited (BULLISH)
3500PE, 3600PE seller addition (BULLISH)

BANKNIFTY for 31st OctoberOption chain is not giving any conclusive levels so we look at charts. Banknifty finished on daily chart as a doji candle with higher high and higher low. with Nifty looking extremely bullish, BNF can't go low so buy at support which coincides with Nifty support. The correct buying area is one which is marked on chart but I don't see it coming there as of tomorrow.
All the best. Happy trading.

BANKNIFTY for 30th OctoberOption chain data for BankNifty (BNF) shows Put writing at all levels. This shows confidence of bulls. Even though highest total OI is at 29000, 2nd highest total OI is at 29500 and 3rd highest total OI is at 30000. Highest Put writing, though, is at 29500. On CALL side, There is unwinding at almost all levels till 30000. Only appreciable Call writing is at 31000 strike, which shows that Call writers do not see any nearby resistance.
On charts too, similar signals are being seen. Today BNF finished as a strong green candle closing above 29700, which was proving as an hindrance since last few sessions. On charts, There is some resistance at 30300 to 30400 when BNF goes beyond 30000, so it will take some time before we reach there. For buyers there is clear-cut buying area as marked on 15 min chart. Go long only, mood is too bullish to short at any level.
All the best. Happy trading.

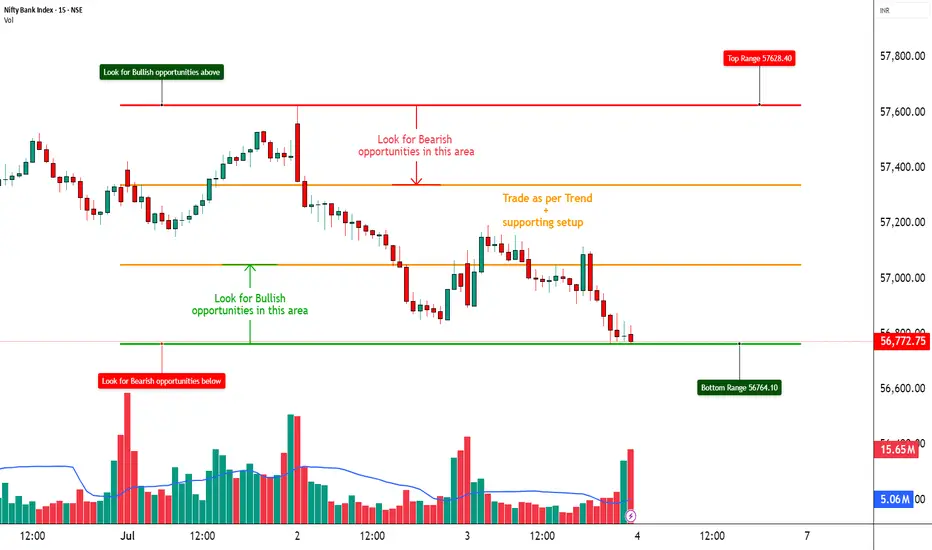
BANKNIFTY – On the Edge of Breakdown📈 BANKNIFTY – On the Edge of Breakdown | Option Chain + Price Action Analysis
🕒 Chart Type: 15-Minute
📆 Date: July 3, 2025
🔍 What’s Catching Our Eye:
BANKNIFTY is sitting dangerously close to the ₹56,770 support zone, which has been tested multiple times. Price action remains weak, and failure to bounce indicates rising pressure on this level.
📌 What We’re Watching For:
We’re closely monitoring the price action near ₹56,770 — a breakdown below this key level could trigger a sharp pick-up in bearish momentum. On the flip side, any meaningful reversal setup will only be considered valid if BANKNIFTY reclaims ₹57,100 with a strong bullish candlestick supported by volume. As of now, the option chain data continues to heavily favor the bears, offering more confirmation than speculation for a potential downside move.
📊 Volume Footprint:
The current volume stands at 149.89M, slightly lower than the previous session’s 162.75M, indicating a mild drop in participation. This suggests that traders are in a wait-and-watch mode. A sharp surge in volume—especially on a move below ₹56,770—could validate a breakdown and trigger momentum on the downside.
📈 Option Chain Highlights:
The 57000 PE is showing a strong long build-up, signaling that traders are positioning for further downside. On the other hand, the 57000 CE has witnessed a heavy short build-up, reinforcing the bearish sentiment. Additionally, lower strike PEs between 56700 and 56900 are also displaying long build-up, further confirming downside pressure. Meanwhile, Call OI is increasing at higher strikes, indicating that resistance is likely forming in the 56900–57200 range.
🔁 Trend Bias:
🔴 Bearish unless we reclaim and sustain above ₹57,100 with confirmation
🧠 Trade Logic / Reasoning:
There is a visible and well-established supply zone between ₹57,400 and ₹57,600, which has consistently capped upside attempts. On the downside, the ₹56,770 support is showing signs of exhaustion due to repeated tests. Derivative data continues to favor the sellers, with strong bearish positioning in the option chain. As there is no visible sign of a reversal yet, it's prudent to remain cautious on taking any premature long positions.
📍 Important Levels to Mark:
🔺 Top Range: 57,600 - Look for breakout or reversal candlestick pattern + volume
🔻 Bottom Range: 56,770 - Watch for breakdown or bullish reversal pattern + volume
🎯 Trade Plan (Educational Purpose Only):
✅ Best Sell: 57000 PE – Long Build-Up present, indicating institutional downside play
✅ Best Buy: 56500 CE – if reversal above 57,100 is confirmed with price action
🟢 Demand Zone: NA
🔴 Supply Zone: NA
⚠️ Invalidation Below:
Any bullish view becomes invalid if BANKNIFTY breaks and holds below 56,750 with high volume
⚠️ Disclaimer:
This post is for educational purposes only.
STWP is not a SEBI-registered advisor.
This is not a buy/sell recommendation.
Please consult your financial advisor before trading.
STWP is not responsible for any trading outcomes.
💬 Found this helpful?
Drop your thoughts in the comments ⬇️
🔁 Share with fellow traders
✅ Follow STWP for zone-based price action & option chain insights
🚀 Let’s boost awareness of smart & patient trading!
Will Nifty cross 15000 tomorrow?That’s the question on everybody’s mind- Will Nifty cross 15k tomorrow (today’s high was 14913.70). Let’s examine through usual data:
1) FII & DII figures: FIIs were net buyers in Cash (impressive 1936.74 Crs) and DIIs were net Sellers (-768.55 Crs). In index futures though FIIs were Net sellers (-1555.11 Crs) and net buyers in stock futures (518 Crs). This means FII is unabashedly buying in equity left, right and centre like in pre-budget-profit booking days (i.e. before 20th Jan) but they are apprehensive of index in near short term- hence the selling ( note also that total selling was only 6113.15 Crs, which means FIIs sold approx. 25% more than they bought).
2) Option chain: On PUT side, highest total OI is understandably at 14500 (17,305 lots) and highest PUT writing also on same strike (10692 lots). 2nd highest total OI (11871 lots) is at 14700 and 2nd highest PUT writing (7,875 lots) is at 14800, where total OI is seen at 11,404 lots which is also significant. So, in a nutshell 14800 and then 14700 are looking as good supports. On CALL side, highest total OI (23,274 lots) and 2nd highest CALL writing is at 15000 strike and highest CALL writing (14,764 lots) is at 15500 strike- almost 600 points away! Such is the fear of Nifty rising! And that is why we have such high VIX, though it fell today. Interestingly 2nd highest total OI is at 15500-again 600 points away.
3) Charts- On daily chart look at the curve outlining Nifty highs (roughly) for past 4 sessions. Doesn’t it look like it is topping out? One more observation – Nifty and banknifty futures closed at discount than their respective spot prices.
4) At the time of writing this ( 11:10 pm) DJIA ( Dow jones ind. Average) is trading 241 points up (0.78% up). SGX Nifty closed at 14900.
So the world markets are looking good which means opening would be good/ gap –up. But 15000 will present resistance as suggested by option chain and chart as well. Remember FIIs too sold Nifty futures in significant amount and index futures closed in discount. The last three data points suggest that even though Nifty may open gap up and touch 15000, it will be very difficult for it to sustain there and selling may start. Therefore one can Sell nifty at 15000 and buy near today’s low between 14715-14750 (between 2 supports as pert option chain).

option and databse trading Traders use an options chain to choose the specific option contracts that best align with their trading strategy. They can select options with the desired strike prices and expiration dates based on their market outlook. Options chains are crucial for assessing and managing risk.
Nifty option chain is considered to be the best advance warning system of sharp moves or break outs in the index.
